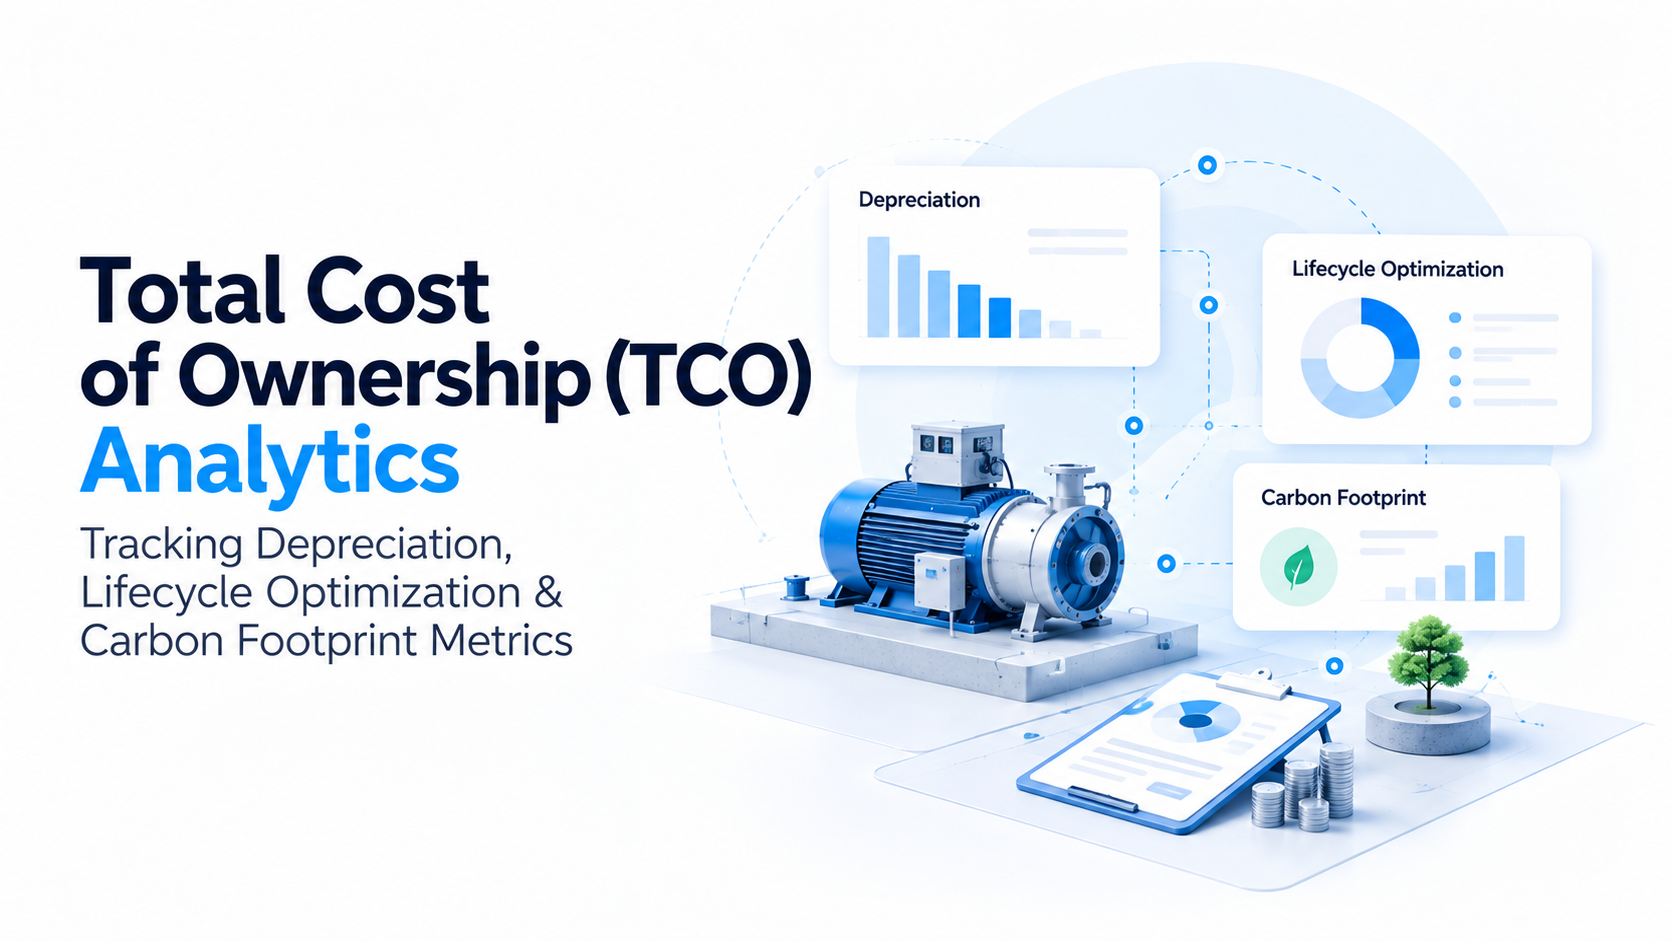
Total Cost of Ownership (TCO) Analytics: Tracking Depreciation, Lifecycle Optimization, and Carbon Footprint Metrics
The price you pay for an asset is only the first payment. A generator, a delivery vehicle, a CNC machine, or an air-handling unit will also cost you fuel or electricity, spare parts, technician time, downtime, insurance, compliance work, and eventually disposal. Over the life of the asset, these later costs can be larger than the purchase price.
Total Cost of Ownership (TCO) is the practice of adding up all of these costs, across the full life of an asset, so that decisions about buying, maintaining, and replacing it are based on the real figure and not just the invoice.
This article explains what goes into TCO, how depreciation fits in, how to use lifecycle data to decide when to replace an asset, and how to add carbon footprint to the picture. It also covers the data you need to collect and the mistakes that make TCO figures unreliable.
What Is Total Cost of Ownership?
TCO is the sum of every cost connected to an asset from the moment you decide to acquire it until it leaves your books. A common way to organise these costs is in four groups.
1. Acquisition costs
- Purchase price
- Taxes, duties, and freight
- Installation and commissioning
- Initial training for operators and technicians
- Financing costs, if the asset is bought on credit or leased
2. Operating costs
- Energy or fuel consumption
- Consumables such as lubricants, filters, and coolants
- Operator labour
- Insurance
- Licences and statutory fees
3. Maintenance and repair costs
- Preventive maintenance labour and parts
- Corrective repairs after breakdowns
- Overhauls and major component replacements
- Contractor and vendor service fees
- Spare parts inventory holding costs
4. End-of-life costs
- Decommissioning and removal
- Disposal or recycling fees
- Environmental clean-up where required
- Residual or scrap value, which reduces the total
There is also a fifth group that is easy to miss: the cost of downtime. When an asset fails, you lose production, delay deliveries, pay overtime to catch up, or rent a replacement. This cost is real even though it does not appear as a line on a maintenance invoice. Where you can estimate it, include it.
Why Purchase Price Is a Poor Guide
Consider two pumps with the same capacity. Pump A costs less to buy. Pump B costs more, but uses less power and needs service less often. If the pumps run for many hours a year, the difference in electricity and maintenance can outweigh the price gap within a few years, and Pump B becomes the cheaper choice over its life.
This pattern applies across asset types. Lower-priced equipment is not always cheaper to own, and higher-priced equipment is not always better. Only a TCO comparison shows which is true for your conditions: your usage hours, energy prices, maintenance capability, and downtime costs.
Depreciation: What It Tells You and What It Does Not
Depreciation spreads the cost of an asset across its useful life in your accounts. Common methods include:
- Straight-line: an equal amount each year
- Declining balance: a larger amount in early years, smaller later
- Units of production: based on actual usage, such as machine hours or kilometres
Depreciation is essential for financial reporting and tax, and the rules that apply depend on your country and accounting standards. In India, for example, companies follow the depreciation requirements of the Companies Act, 2013 for financial statements, while tax depreciation follows the Income Tax Act. Your finance team owns these rules.
Depreciation is not the same as TCO
An asset can be fully depreciated on paper and still be useful, or it can have a high book value and be unreliable. Depreciation is an accounting allocation of the purchase cost only. It does not include the cost of running and maintaining the asset. For maintenance and replacement decisions, TCO gives a more useful view, while depreciation gives the financial reporting view. Good asset management uses both, and keeps them linked to the same asset record.
What to track alongside depreciation
For each asset, keep these fields together:
- Acquisition date and cost
- Depreciation method and useful life assumed
- Current book value
- Cumulative maintenance and repair cost
- Cumulative operating cost
- Downtime hours
When these live in the same system, you can see at a glance whether an asset that is nearly written off is quietly becoming expensive to keep running.
Lifecycle Optimisation: Finding the Right Time to Replace
Most assets follow a familiar cost pattern. Early in life, maintenance costs are low. As the asset ages, repairs become more frequent and more expensive, and reliability drops. At some point, the annual cost of keeping the old asset running exceeds the annual cost of owning a new one.
The aim of lifecycle optimisation is to find that point, which is often called the economic life of the asset, and to plan replacement around it rather than around a breakdown.
A simple method: equivalent annual cost
One widely used approach compares the equivalent annual cost (EAC) of keeping the current asset with the EAC of a replacement. The idea is to convert all costs of each option into an average yearly cost so that assets with different lifespans can be compared fairly.
At a high level:
- Estimate the future costs of keeping the existing asset for one more year, two more years, and so on
- Estimate the purchase price, expected operating costs, and maintenance costs of the replacement
- Calculate the average yearly cost of each option
- Choose the option with the lower average yearly cost
Your finance team can help with the discounting method. You do not need advanced maths to begin. Even a simple comparison of last year's total cost of ownership per year for the old asset against the quoted yearly cost of a new one will show whether the conversation should start.
Signals that an asset is approaching replacement
- Repair cost in a year is approaching a significant share of replacement cost
- Breakdown frequency is rising
- Spare parts are hard to find or the manufacturer has ended support
- Energy use per unit of output is higher than for newer models
- Safety or compliance risk is increasing
- Downtime is affecting production or service commitments
None of these alone should trigger replacement. Together, they point to a decision that needs a business case.
Options besides replace or run to failure
Lifecycle decisions are not limited to two choices. Consider also:
- Refurbishment or overhaul to extend life at a lower cost than replacement
- Retrofit with efficient components, such as a variable-speed drive on a motor
- Redeployment of the asset to a lighter duty
- Leasing or renting for assets with uncertain long-term need
- Disposal without replacement if the need has changed
Each option can be assessed with the same TCO method.
Adding Carbon Footprint to TCO
Many organisations now report on emissions, either because of regulation, customer requirements, investor expectations, or internal targets. Assets are a major source of emissions, through fuel burned, electricity consumed, refrigerant leaks, and the emissions embedded in manufacturing the asset.
Including carbon in TCO lets you see the environmental cost next to the financial one.
The three scopes, in asset terms
The Greenhouse Gas Protocol, a widely used reporting framework, divides emissions into three scopes:
- Scope 1: direct emissions from sources you own or control, such as diesel used in your generators and vehicles, or refrigerant leaks from your equipment
- Scope 2: indirect emissions from purchased electricity, steam, heating, or cooling used by your assets
- Scope 3: other indirect emissions in your value chain, including the emissions from manufacturing the equipment you buy
For most maintenance and asset teams, Scope 1 and Scope 2 are the ones they can measure and influence directly. Scope 3 is harder to measure and usually depends on supplier data.
How to estimate an asset's carbon footprint
A practical method for operating emissions is:
Emissions = Activity data × Emission factor
- Activity data is what the asset consumed: litres of diesel, kilowatt-hours of electricity, kilograms of refrigerant lost
- Emission factor is the amount of greenhouse gas released per unit of that activity
Emission factors change with fuel type, region, and year, so use factors from a recognised, current source that fits your country and your reporting framework, and record which source and year you used. Do not use a factor from memory or from an unnamed website.
Once you have an emission figure per asset per year, you can:
- Compare assets of the same type and spot the high emitters
- Compare a replacement's expected emissions against the current asset's
- Set an internal carbon cost, if your organisation uses one, and add it to the TCO calculation
- Support reporting requirements with traceable data
Practical uses
- Fleet: compare fuel use per kilometre across vehicles and see whether older vehicles justify replacement on cost and emissions together
- HVAC and chillers: track energy and refrigerant top-ups to find equipment that is losing efficiency
- Motors and pumps: check whether efficient replacements or drives would reduce energy use enough to justify the investment
- Generators: track running hours and fuel to plan servicing and identify overuse
The Data You Need
TCO analytics depends on record quality. The main data sources are:
- Asset register: unique ID, category, location, make, model, purchase date, cost
- Work order history: labour hours, parts used, cost, failure cause, downtime
- Meter and usage data: runtime hours, kilometres, energy consumption
- Purchasing and inventory data: part prices, contract rates
- Finance data: depreciation schedule, book value
- Energy and fuel data: bills, fuel logs, sub-meter readings
The most common obstacle is that these data sit in separate systems: spreadsheets in maintenance, purchase data in ERP, energy bills in finance. A central asset management system that links work orders, costs, and usage to each asset record makes TCO analysis routine rather than a special project.
Key TCO Metrics to Track
- Total cost per asset, per year: all costs divided by years in service
- Maintenance cost as a share of asset replacement value: an indicator of ageing cost
- Cost per operating hour, per kilometre, or per unit produced: allows comparison across assets of different use
- Mean time between failures (MTBF): shows reliability trend
- Downtime hours and estimated downtime cost
- Energy or fuel use per unit of output
- Emissions per asset, and per unit of output
- Planned versus unplanned maintenance ratio: a higher planned share usually indicates better control
Pick a small set that suits your assets and review it on a regular schedule, monthly or quarterly.
Common Mistakes
- Counting only maintenance invoices. Internal labour, parts from stock, and downtime are also costs.
- Mixing asset records. If one pump appears under three names, its history is split and its true cost is hidden.
- Using estimates without stating them. Be clear about which figures are measured and which are assumed.
- Ignoring residual value and disposal cost. Both change the final result.
- Ignoring the differences in usage. A lightly used asset and a heavily used asset should be compared per unit of use.
- Treating carbon as a separate exercise. Keep it in the same asset record so that it can be considered in each decision.
- Analysing once and never again. TCO changes as an asset ages, so review it regularly.
Getting Started: A Simple Plan
- Choose a pilot group of assets that are high in cost, high in risk, or both.
- Clean the asset records for those assets: unique IDs, correct dates, correct locations.
- Collect five years of cost history, where available, from work orders, purchasing, and finance.
- Add usage and energy data, starting with the data you already have.
- Calculate annual TCO for each asset and rank them.
- Review the top and bottom of the list with maintenance and finance teams.
- Decide on actions: repair, retrofit, replace, or continue as is.
- Extend to the wider asset base once the process is working.
Conclusion
TCO analytics changes the question from "what does this asset cost?" to "what does this asset cost us over its whole life, and what is the best time to replace it?" By tracking depreciation alongside real operating and maintenance cost, you can see which assets are worth keeping. By adding carbon footprint, you can make replacement decisions that consider both money and emissions.
The starting point is always the same: complete, connected asset records. When purchase data, work orders, usage, and energy live in one system, lifecycle analysis becomes something you can run every month.
Spectent Asset helps teams keep asset records, maintenance history, and lifecycle costs together so that TCO reviews are based on real data. Talk to the Spectent team to see how it works for your assets.